For NRL live bettors, few moments create bigger market swings than a sin bin. The moment a player is sent from the field for ten minutes, bookmakers rapidly adjust odds across markets such as next team to score, total points, and winning margin. The challenge is knowing whether those adjustments accurately reflect the true scoring impact of the numerical advantage.
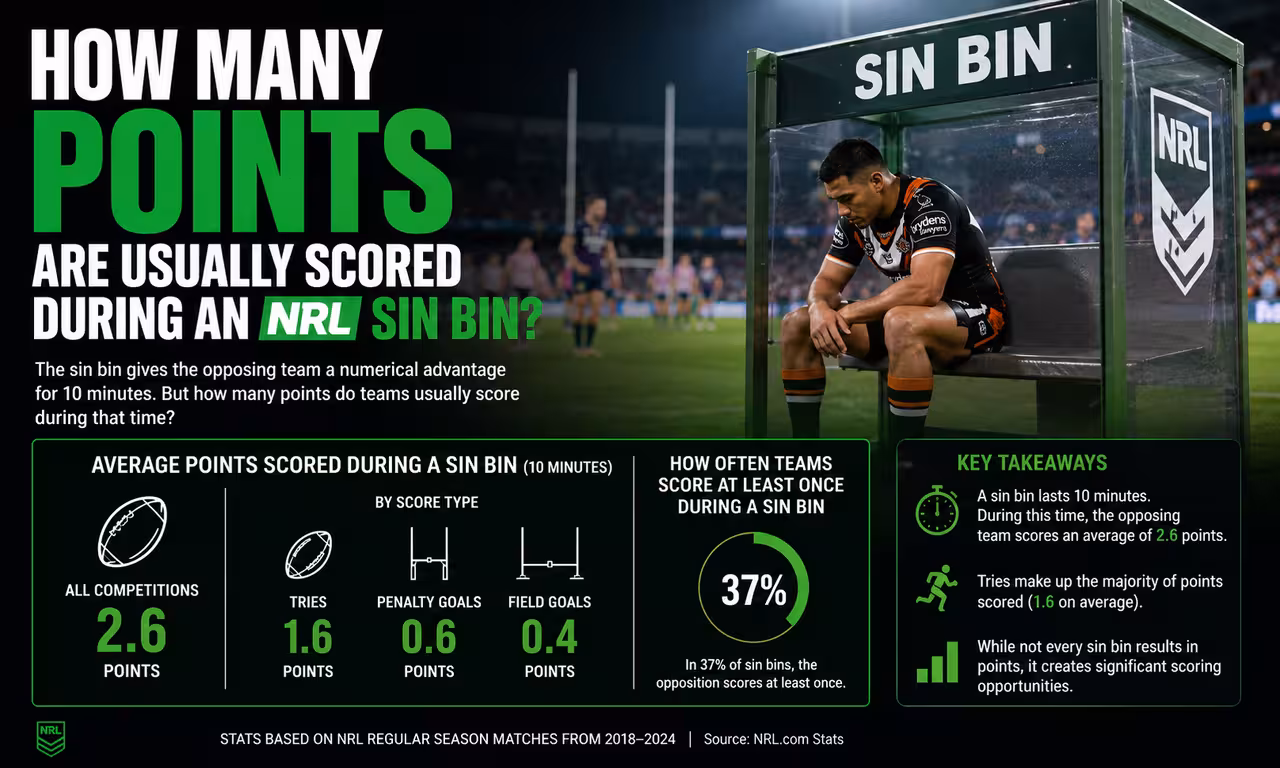
Most bettors understand that playing against 12 men increases scoring opportunities, but very few know how many points are typically scored during that period. By analysing historical NRL data and scoring trends, bettors can move beyond guesswork and make more informed live betting decisions. This guide explores the average points scored during a sin bin and how to apply those insights in real-time betting situations.
Why Sin Bins Have Such a Big Impact on Live Markets
When a player is sent to the sin bin, the game changes immediately. The team reduced to 12 players must work harder defensively, cover additional space, and often abandon parts of its normal structure simply to survive the next ten minutes. This creates opportunities for the opposition to exploit mismatches and generate scoring chances that might not otherwise exist.
Bookmakers understand this dynamic very well. The moment a sin bin occurs, their models begin recalculating probabilities across numerous markets. The expected points total may increase, the favourite's winning probability may improve, and the likelihood of the advantaged team scoring next often rises significantly. These adjustments happen so quickly that many casual bettors struggle to evaluate whether the new prices still represent value.
Understanding the historical scoring impact of sin bins helps bridge this knowledge gap. Instead of reacting emotionally to a player's dismissal, you can compare the market's reaction against historical averages and determine whether the adjustment appears reasonable.
Building a Reliable Sin Bin Dataset
Any meaningful analysis begins with reliable data. If you want to understand how many points are typically scored during an NRL sin bin, you need more than final scores and basic match reports. The focus must be on isolating the exact ten-minute period during which the player is off the field and measuring what happens within that specific window.
This process requires detailed event tracking. Every sin bin needs to be logged with accurate timestamps, the score at the start of the period, and every scoring play that occurs before the player returns. Without this level of precision, the results become unreliable because points scored outside the sin bin period can distort the analysis.
The larger the sample size, the more useful the findings become. Analysing a handful of games may produce misleading conclusions, whereas analysing hundreds of sin bins across multiple seasons provides a much clearer picture of the true scoring impact.
Key Variables Worth Recording
To build a useful database, you need to capture more than just the final scoring outcome. Several supporting variables help explain why certain sin bins produce points while others do not.
Important variables include:
- Match ID
- Sin bin start time
- Sin bin end time
- Team reduced to 12 players
- Opposing team
- Score before sin bin
- Score after sin bin
- Points scored during the period
- Type of scoring play
Collecting these variables consistently allows you to move beyond simple averages and begin identifying patterns. Over time, you'll be able to compare different situations and determine which types of sin bins create the greatest scoring opportunities.
The goal isn't simply to count points. It's to understand the circumstances that lead to those points being scored.
A Practical Data Matrix for Analysis
To understand how this information can be structured, consider the following simplified example. While a serious betting model would likely contain hundreds or thousands of entries, this sample demonstrates the basic methodology used to analyse sin bin scoring.
The table below isolates individual sin bin incidents and records how many points the opposing team scored during the ten-minute period.
| Match ID | Sin Bin Start Minute | Team Sin Binned | Opponent Team | Points Scored by Opponent During Sin Bin |
|---|---|---|---|---|
| NRL2024-001 | 15 | Roosters | Rabbitohs | 6 |
| NRL2024-005 | 32 | Panthers | Eels | 0 |
| NRL2024-012 | 58 | Broncos | Cowboys | 4 |
| NRL2024-020 | 25 | Sharks | Knights | 2 |
| NRL2024-028 | 45 | Storm | Warriors | 6 |
| NRL2024-035 | 70 | Titans | Dolphins | 0 |
Looking at this sample, the opposing teams scored a combined 18 points across six sin bin incidents. Dividing 18 by 6 produces an average of 3.0 points per sin bin period. While this sample is far too small to draw definitive conclusions, it illustrates the process used when analysing much larger datasets.
Once hundreds of incidents are included, the averages become far more reliable. More importantly, the data can be segmented by team strength, player position, game state, venue, and other variables that help explain why some sin bins create scoring explosions while others have little impact.
What Historical Data Usually Shows
When larger datasets are analysed, a clear trend begins to emerge. Teams playing against 12 men generally score more points than they would under normal circumstances. While exact figures vary depending on the seasons analysed and the methodology used, many studies place the average scoring impact somewhere between 3.5 and 4.5 points per sin bin period.
This doesn't mean every sin bin results in a converted try. Some periods produce no scoring at all, while others result in multiple tries. The average simply provides a benchmark that helps bettors understand what typically happens across a large number of similar situations.
For live betting purposes, this benchmark becomes extremely useful. It provides a reference point against which you can compare bookmaker adjustments and determine whether the market is overreacting or underreacting to the dismissal.
Why Context Matters More Than the Average
While averages provide a valuable starting point, they should never be treated as predictions. Every sin bin occurs within a unique game situation, and those circumstances can dramatically influence the outcome.
A top attacking side facing a struggling defence will often exploit a numerical advantage far more effectively than an average team. Likewise, a sin bin occurring five metres from the defending team's try line creates a much greater immediate scoring threat than one occurring near halfway.
Other contextual factors can also influence outcomes, including:
- Team quality
- Current scoreline
- Weather conditions
- Remaining game time
- Player position
- Field position
Understanding these variables allows bettors to move beyond generic averages and evaluate each situation on its own merits.
The Importance of the Player Sent to the Bin
Not all sin bins have the same impact. The player involved often plays a major role in determining how damaging the dismissal becomes.
Losing a middle forward may weaken defensive structures and increase fatigue among the remaining forwards. Losing a halfback can disrupt attacking organisation and reduce a team's ability to control field position. In contrast, losing a less influential player may have a relatively minor effect on overall performance.
This is why experienced bettors pay close attention to who has been sent from the field. Understanding the role that player performs within the team can provide valuable clues about how likely the opposition is to capitalise.
Applying Sin Bin Data to Live Betting
The primary purpose of this analysis is to improve live betting decisions. Historical scoring data helps you assess whether bookmaker adjustments accurately reflect the likely impact of a sin bin.
For example, if historical averages suggest a scoring impact of roughly four points, but the bookmaker adjusts the total points line by eight points, there may be an opportunity to oppose the market. Conversely, if a strong attacking team gains a numerical advantage and the market barely moves, there may be value in backing additional scoring.
This approach works particularly well in markets such as:
- Next team to score
- Total match points
- Team totals
- Winning margin
- Handicap betting
The goal is not to predict outcomes perfectly but to identify situations where the market may have mispriced the impact of the sin bin.
Understanding the Limitations
Even the best datasets have limitations. Rugby league remains an unpredictable sport, and many factors can disrupt expected outcomes.
Unexpected events such as injuries, errors, weather changes, referee decisions, and tactical adjustments can all influence scoring during a sin bin period. Sometimes a team simply fails to capitalise on the advantage despite creating multiple opportunities.
This uncertainty is why averages should be viewed as decision-making tools rather than guarantees. They improve your understanding of probabilities but cannot eliminate risk entirely.
Responsible Betting and Live Markets
Live betting can be exciting, but it also creates pressure. Markets move quickly, and the temptation to react immediately can lead to impulsive decisions. Understanding sin bin scoring should help you become more analytical, not encourage reckless betting.
Before betting live, always:
- Set a bankroll
- Use sensible stake sizes
- Avoid chasing losses
- Focus on long-term value
The purpose of using data is to make better decisions over time. No individual bet, regardless of how strong the numbers appear, is ever guaranteed to win.
Conclusion
Understanding the average points scored during an NRL sin bin provides valuable insight into one of the most influential moments in live rugby league betting. Historical data suggests that teams typically score between 3.5 and 4.5 points during these ten-minute periods, but the true value comes from understanding the context behind those numbers.
By collecting accurate data, analysing scoring patterns, and considering factors such as team strength, player position, and field position, bettors can make much more informed decisions when markets react to a sin bin. This transforms a moment of uncertainty into an opportunity for structured analysis rather than emotional decision-making.
While no statistic can predict every outcome, combining historical averages with real-time game context provides a significant advantage over relying purely on instinct. Over the long run, that analytical edge can make a meaningful difference to the quality of your live betting decisions.
0 Comments
Comments are reviewed before they appear.No comments yet. Be the first to add one.